 應用篇
應用篇 畫圖
應用篇 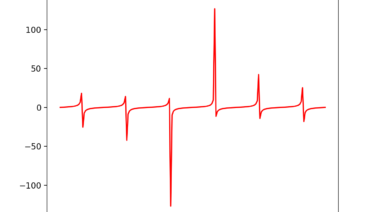 入門篇
入門篇 Python – matplotlib教學, 製作圖表
 應用篇
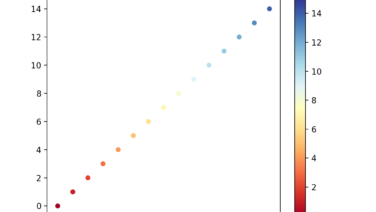
應用篇 Python matplotlib 應用 – 散佈圖(有color bar)
 應用篇
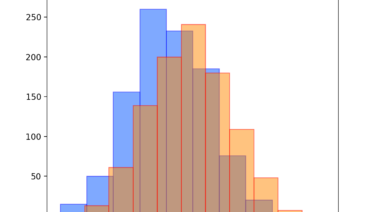
應用篇 Python matplotlib 畫圖 – 柱狀圖 (長條圖)
 應用篇
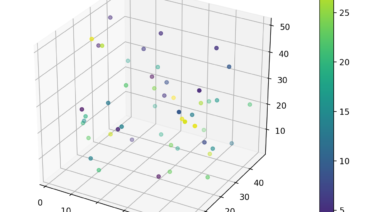
應用篇 Python matplotlib – 3D 散佈圖
 應用篇
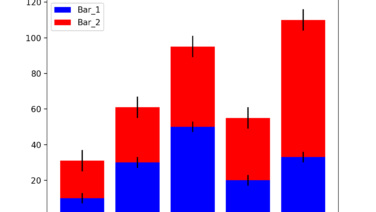
應用篇 Python matplotlib 畫圖 – error bar柱狀圖(長條圖)
 應用篇
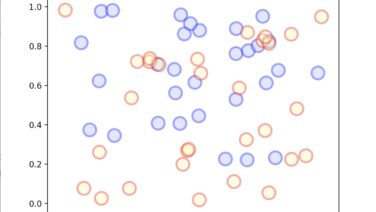
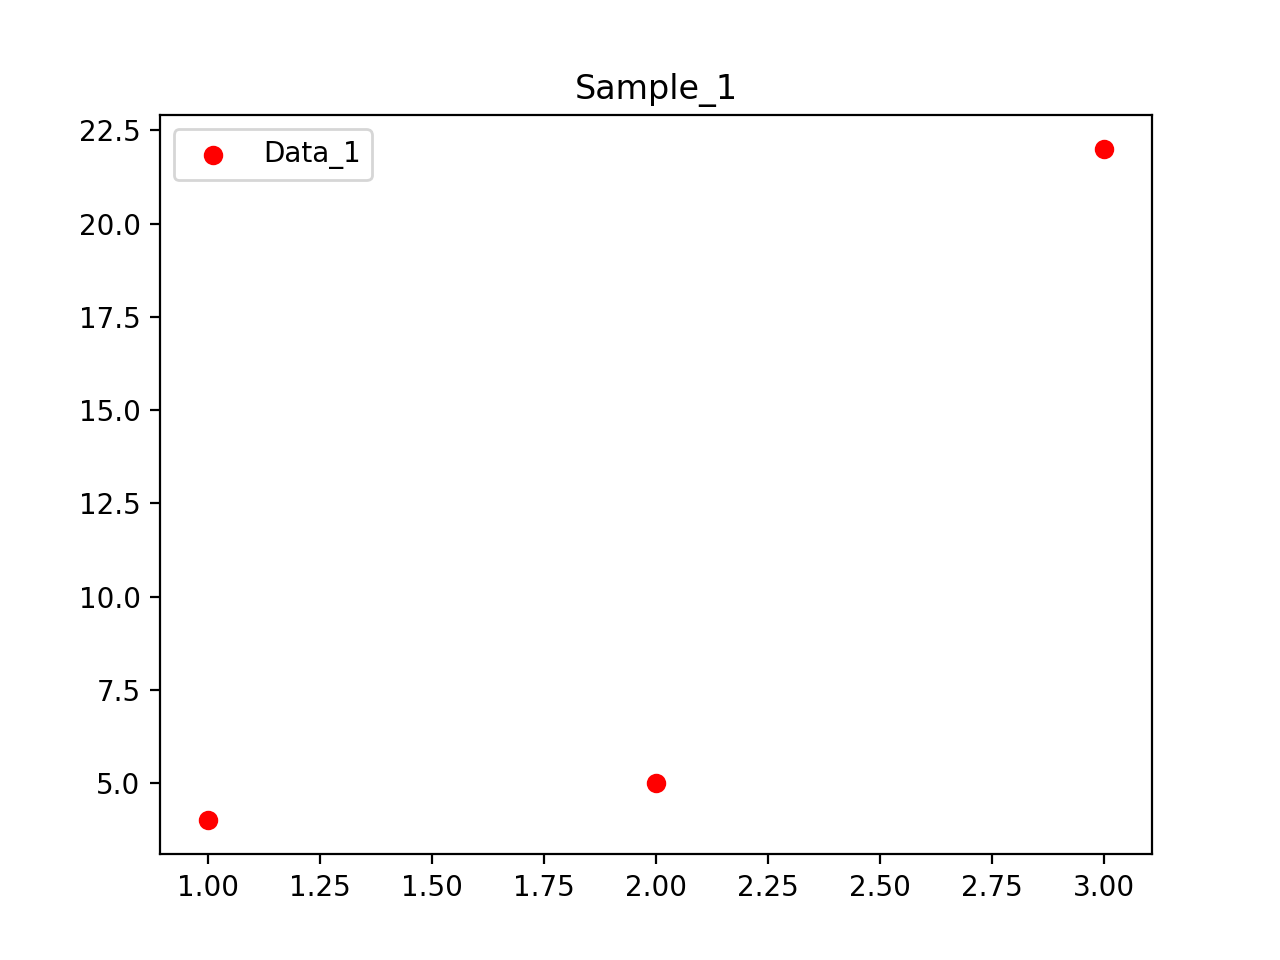
應用篇 Python matplotlib教學 入門 – 散佈圖
 應用篇
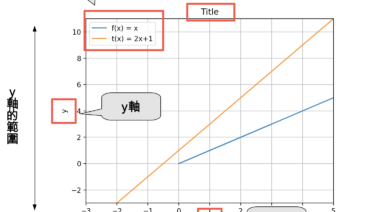
應用篇 matplotlib – axes的使用方法以及圖表的客製化
 應用篇
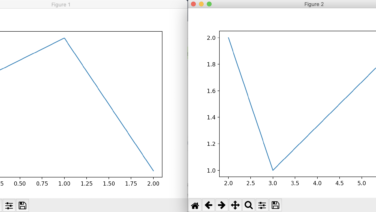
應用篇 Python matplotlib繪圖:figure和axes
 應用篇
應用篇