這次要介紹的是如何使用Python的matplotlib來畫散佈圖。如果對於figure或是axes不了解的人可以先看一下下面的文章。
Python matplotlib的基礎:figure和axes
散佈圖
散佈圖大多是使用二次元的數據來畫成的圖。使用Python畫散佈圖的時候會用到matplotlib的axes.scatter。
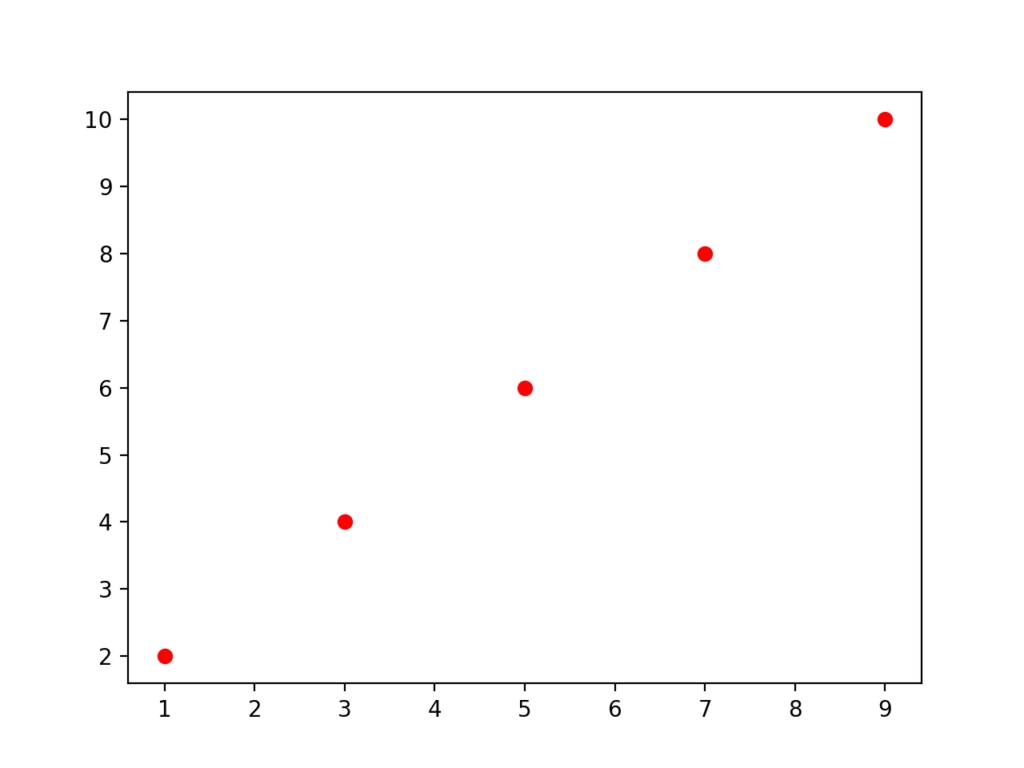
首先我們先來隨便的點五個點。另外在使用pyplot時,X和Y的座標例如:(1, 2), (3, 4), (5, 6)可以寫成X=[1, 3, 5],Y=[2, 4, 6]。
import matplotlib.pyplot as plt

#data
x = [1, 3, 5, 7, 9]
y = [2, 4, 6, 8, 10]

# 製作figure
fig = plt.figure()

#圖表的設定
ax = fig.add_subplot(1, 1, 1)

#散佈圖
ax.scatter(x, y, color='red')
plt.show()
執行之後會出現下面的散佈圖。這就是基礎的散佈圖的製作方式!
如何使用axes.scatter?
首先我們來看一下axes.scatter的詳細變數。
scatter(x, y,
s=None,
c=None,
marker=None,
cmap=None,
norm=None,
vmin=None,
vmax=None,
alpha=None,
linewidths=None,
verts=None,
edgecolors=None)
| 變數 | 說明 |
| x, y | X軸與Y軸的數據 |
| s | 散佈圖的點的大小 |
| c | 顏色,這邊也可以寫成color |
| marker | 散佈圖的點的形狀 |
| alpha | 散佈圖的點的透明度(可以指定0~1,0:完全透明,1:不透明) |
| linewidths | 散佈圖的點的邊緣的線的粗度 |
| edgecolors | 散佈圖的點的邊緣的線的顏色 |
當然除了上面介紹的變數以外還有其他的變數,這邊會在以後再做詳細說明。
變更散佈圖的點的大小,顏色,透明度等等
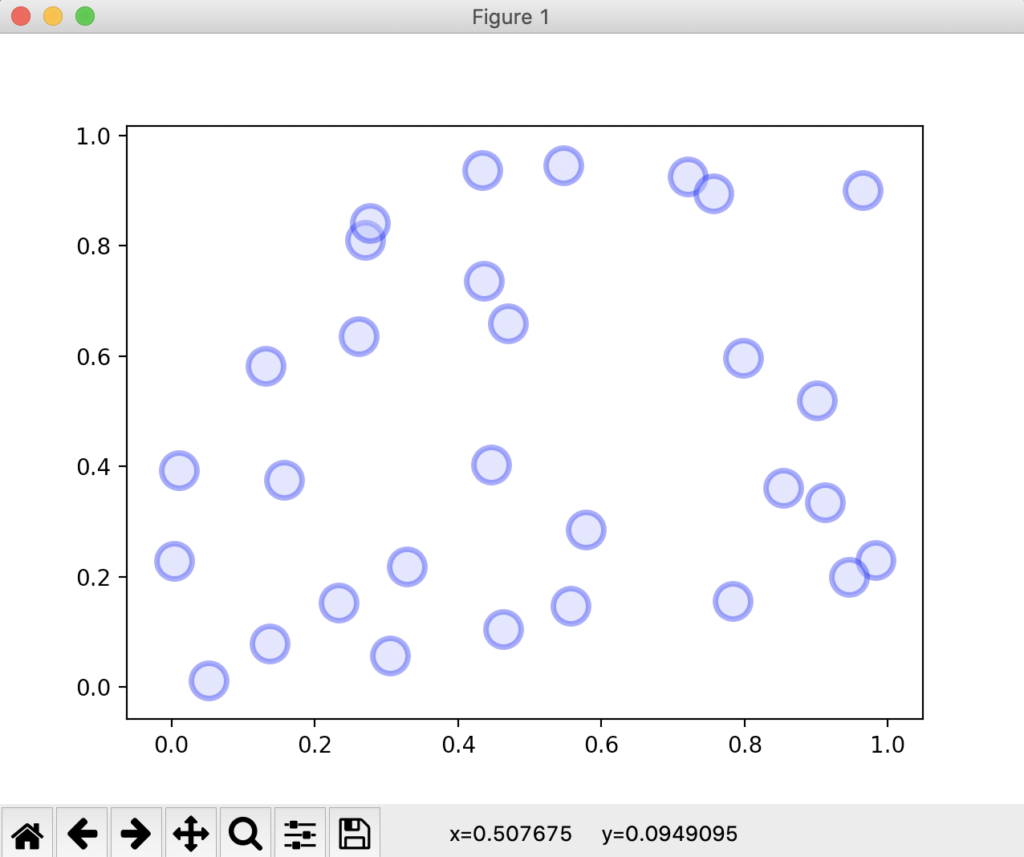
這邊我們來試著客製化我們的散佈圖!我們首先透過s來調整點的大小,接著用alpha來調整透明度,最後用c或是color來調整顏色。另外也配合linewidths來調整緣線的粗度,edgecolors來調整緣線的顏色。另外這次的數據我們利用numpy的random.rand來製作隨機的0~1之間的數據試試看!
import matplotlib.pyplot as plt
import numpy as np

#生成隨機的data 30個
x = np.random.rand(30)
y = np.random.rand(30)

#製作figure
fig = plt.figure()

#設定axes
ax = fig.add_subplot(1, 1, 1)

#設定散佈圖的顏色,大小等等
ax.scatter(x, y, s=250, alpha=0.4, linewidths=2.5, c='#AAAFFF', edgecolors='blue')

plt.show()
執行了上面的代碼之後會出現下面的散佈圖!
因為這次用的是隨機的數據,所以每次執行代碼得到的圖形都會不一樣!如果有興趣的人可以試試看。另外
ax.scatter(x, y, s=250, alpha=0.4, linewidths=2.5, c='#AAAFFF', edgecolors='blue')中的c=’#AAAFFF’代表的是點的顏色,而這之中的英文字分別是代表著16進位的數字。如果想嘗試看看其他顏色的話可以點下面的連結!

用不同顏色來區分數據
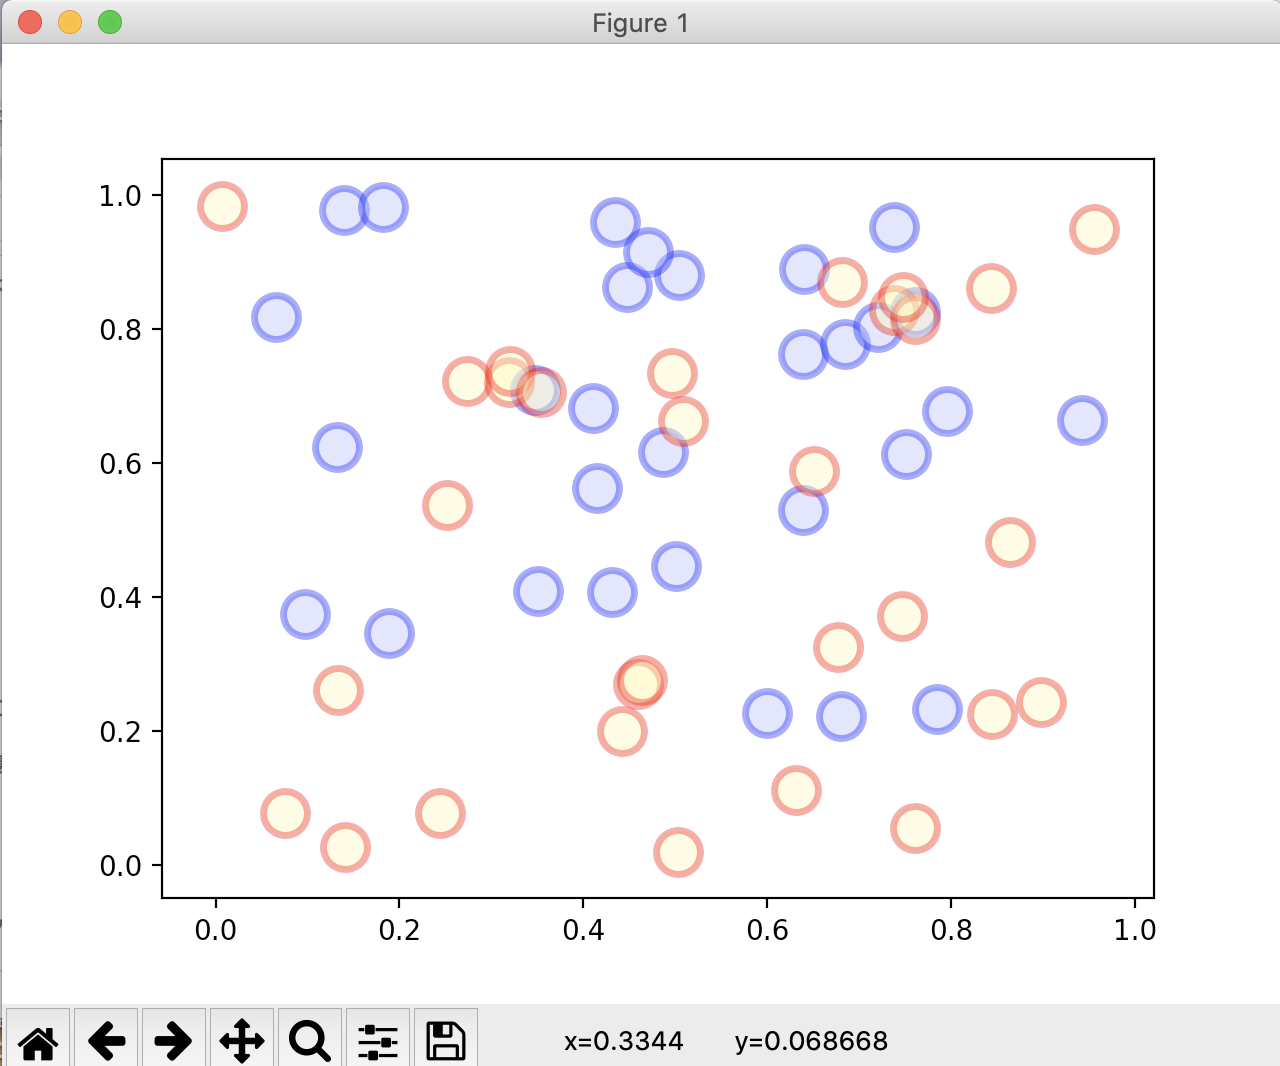
看過了剛剛的代碼之後,應該已經知道了散佈圖的基本做法了!這邊我們要來看看要如何用不同的顏色來區分不同的數據。首先我們先用紅色以及藍色來做區分!
import matplotlib.pyplot as plt
import numpy as np

#生成隨機的data 30個
x1 = np.random.rand(30)
y1 = np.random.rand(30)
x2 = np.random.rand(30)
y2 = np.random.rand(30)


#製作figure
fig = plt.figure()

#設定axes
ax = fig.add_subplot(1, 1, 1)

#設定x1, y1散佈圖的顏色,大小等等(藍色)
ax.scatter(x1, y1, s=250, alpha=0.4, linewidths=2.5, c='#AAAFFF', edgecolors='blue')

#設定x2, y2散佈圖的顏色,大小等等(紅色)
ax.scatter(x2, y2, s=250, alpha=0.4, linewidths=2.5, c='#FFFAAA', edgecolors='red')

plt.show()
執行後會出現下面的散佈圖!

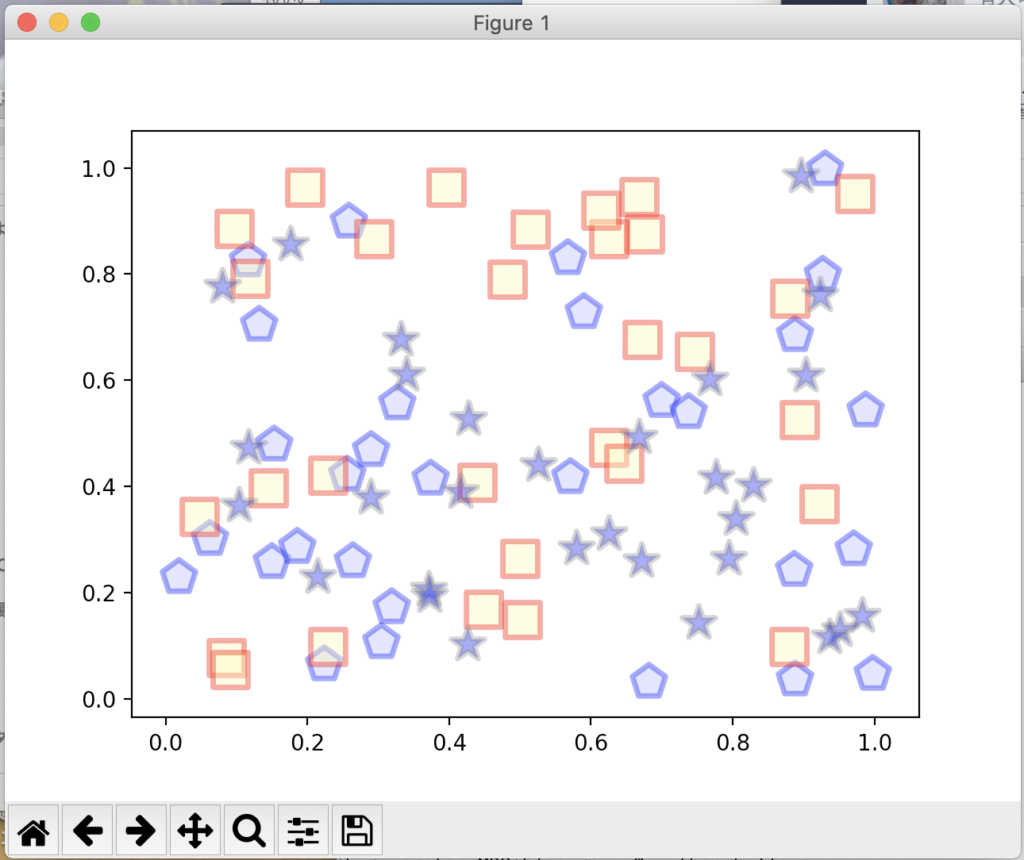
指定點的形狀
在散佈圖中,我們大部分是使用圓形的點,不過可以透過改變marker的設定來改變圖形。下面是常見到的圖形。
- o : 圓形
- D : 菱形
- s : 四角形
- p : 五角形
- * : 星形
另外還有很多圖形,其實大部分是使用那個圖形的英文的第一個字母。另外如果想要使用自訂的圖形的話,可以在$符號之中輸入你想要的圖形或是字母。
import matplotlib.pyplot as plt
import numpy as np

#生成隨機的data 30個
x1 = np.random.rand(30)
y1 = np.random.rand(30)
x2 = np.random.rand(30)
y2 = np.random.rand(30)
x3 = np.random.rand(30)
y3 = np.random.rand(30)


#製作figure
fig = plt.figure()

#設定axes
ax = fig.add_subplot(1, 1, 1)

#五邊形
ax.scatter(x1, y1, s=250, alpha=0.4, linewidths=2.5, c='#AAAFFF', edgecolors='blue', marker='p')
#方形
ax.scatter(x2, y2, s=250, alpha=0.4, linewidths=2.5, c='#FFFAAA', edgecolors='red', marker='s')
#星形
ax.scatter(x3, y3, s=250, alpha=0.4, linewidths=2.5, c='b', edgecolors='gray', marker='*')

plt.show()
執行之後就會出現有方形,五邊形,以及星形的散佈圖了!
圖例,標題等等
最後,在Python matplotlib – axes的使用方法以及圖表的客製化中說明過,一個完整的散佈圖應該會有標題,圖例,x, y軸名稱等等。這邊我們就以剛剛的範例來做更改。
import matplotlib.pyplot as plt
import numpy as np

#生成隨機的data 30個
x1 = np.random.rand(30)
y1 = np.random.rand(30)
x2 = np.random.rand(30)
y2 = np.random.rand(30)
x3 = np.random.rand(30)
y3 = np.random.rand(30)


#製作figure
fig = plt.figure()

#設定axes
ax = fig.add_subplot(1, 1, 1)

#五邊形
ax.scatter(x1, y1, s=250, alpha=0.4, linewidths=2.5, c='#AAAFFF', edgecolors='blue', marker='p')
#方形
ax.scatter(x2, y2, s=250, alpha=0.4, linewidths=2.5, c='#FFFAAA', edgecolors='red', marker='s')
#星形
ax.scatter(x3, y3, s=250, alpha=0.4, linewidths=2.5, c='b', edgecolors='gray', marker='*')

#圖例,標題等
ax.grid(True)
ax.set_xlim(left=0, right=1.2)
ax.set_ylim(bottom=-0, top=1.2)
ax.set_xlabel('x')
ax.set_ylabel('y')
ax.set_title('Sample Title')
ax.legend(['x1, y1', 'x2, y2', 'x3, y3'])

plt.show()
執行後結果
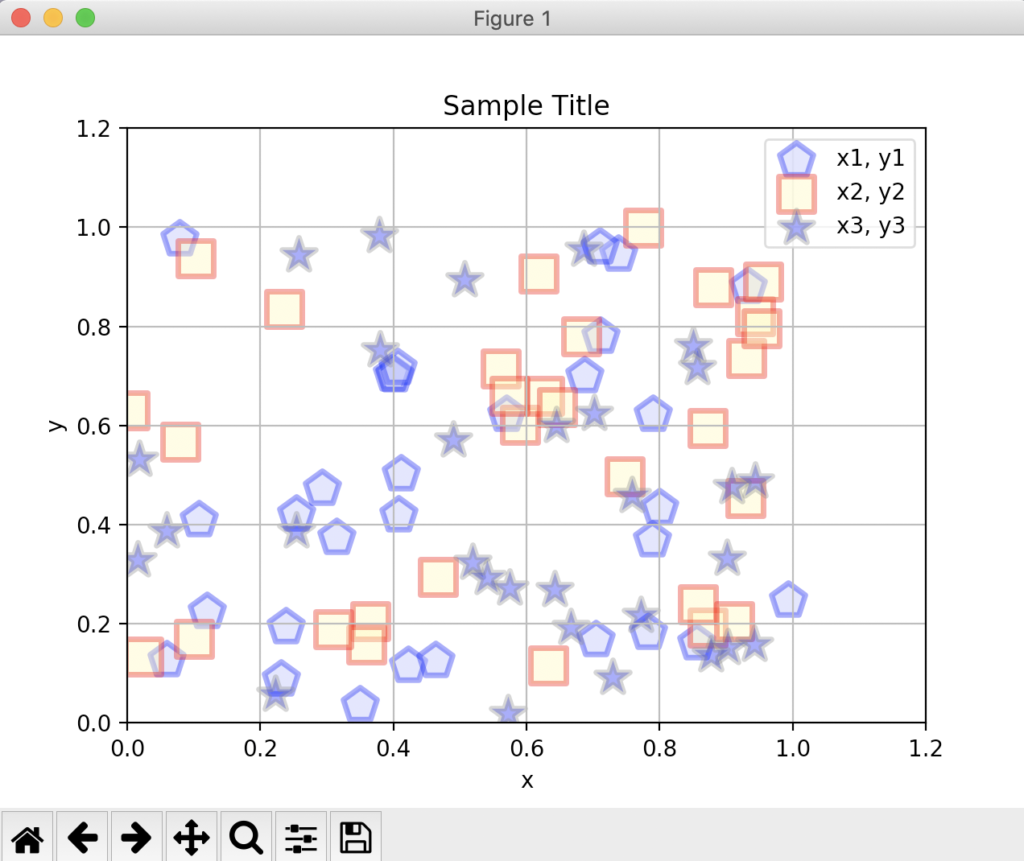
在這邊我們可以確認到散佈圖的標題,X, Y軸名稱,範圍,方格的有無以及圖例名稱。我們就完成了一個散佈圖了!

留言
I think the admin of this site is truly working hard in favor
of his site, as here every data is quality based stuff.
Thanks!
I’m pretty pleased to find this page. I need
to to thank you for your time for this wonderful read!!
I definitely appreciated every bit of it and i also have you saved to
fav to check out new stuff on your blog.
Thank you!
Pretty nice post. I simply stumbled upon your blog and wanted
to mention that I’ve really loved surfing around your weblog posts.
In any case I will be subscribing on your feed and I’m hoping you write
again very soon!
Thanks for your marvelous posting! I genuinely enjoyed reading it, you might be a great author.I will remember to bookmark your blog and
definitely will come back from now on. I want to encourage
you to ultimately continue your great posts, have a
nice weekend!